Aquatic Invasive Species Pond and Lake Vulnerability Prioritization for New York
Project Sponsor: New York State Department of Environmental Conservation
End Date: June 30, 2022
Summary
The goal of this project is to provide spatial information to help prioritize aquatic invasive species surveys and management efforts of lakes and ponds. With guidance from statewide partners, we developed an online tool that allows users to select risk thresholds for invasive species introduction, establishment, and impact to select a subset of lakes. Managers can use the resulting outputs to help guide their aquatic survey or management priorities.
Launch the Prioritization Tool - Jump to tool instructions and tips.
Project Need and Background
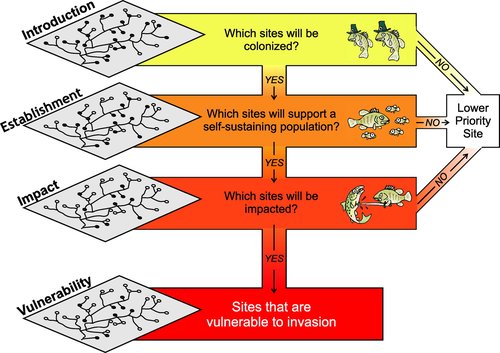
Fig 1. from M. Jake Vander Zanden and Julian D. Olden. A management framework for preventing the secondary spread of aquatic invasive species. Canadian Journal of Fisheries and Aquatic Sciences. 65(7): 1512-1522. https://doi.org/10.1139/F08-099. © Canadian Science Publishing or its licensors.
Invasive species continue to pose a threat to our natural communities, native species, and agricultural systems. New York State is very active in tracking invasive species with iMapInvasives and coordinating invasive species management, such as with the Partnerships for Regional Invasive Species Management (PRISMs). To support these efforts we developed a GIS layer for terrestrial prioritization that is available as an ArcGIS online service. The goal of this project is to provide a tool to support prioritization for survey, assessment, and management of 8,683 lakes and ponds for invasive species in New York.
This project is based on a management framework introduced by Vander Zanden and Olden in 2008, where they suggest vulnerability is based on: 1. The ability of a lake to be colonized (introduction), 2. Once colonized, the ability for the lake to support a self-sustaining population (establishment), and 3. The impact the invasion will have on the lake (impact).
Steering Committee
We worked with a steering committee with representation from:
- New York State Department of Environmental Conservation (NYSDEC)
- Invasive Species Coordination Unit
- Division of Water
- New York Natural Heritage Program (NYNHP)
- New York State Office of Parks, Recreation, and Historic Preservation
- Partnerships of Regional Invasive Species Management (PRISM)
- US Fish and Wildlife Service
- Hudson River National Estuarine Research Reserve
- Lake Champlain Basin Program
Methodological Approach
The first step was to ascertain what dataset of water bodies is most appropriate to use as our core set of “lakes and ponds.” We started with the Northeast Lake and Pond Classification developed by The Nature Conservancy. We added data from the NYSDEC Division of Water.
To be as current and accurate as possible, we updated attributes related to NLCD (National Land Cover Database) metrics to the most recently available (2016) NLCD. Thus, we updated information for each waterbody for land cover information within 100 and 1000 meters and within the full upstream accumulation area (watershed) for the waterbody. Values for 60 variables were replaced in total.
With advice from the steering committee, we then developed metrics relating to each component of vulnerability, as follows.
Component 1: Lakes at Risk of Introduction
The advisory committee identified recreational boating, waterfowl, and waterways as known vectors of aquatic invasive species introduction. Therefore, we quantified the risk of invasive species introduction using the following metrics: boat traffic (modeled using Watercraft Inspection Steward Program [WISPA] data, road traffic data, and more), and proximity to known infestations (downstream distance from iMapInvasives presence records, as well as the number of iMapInvasives presence records within a search radius based on bird foraging distances).
| Risk of Introduction Variable | Weight in Risk Score | Variable is a measure of… | Calculation Summary | Data Source |
|---|---|---|---|---|
| Boat Traffic | 4 | Risk of invasive introduction via motor boat or personal watercraft | Predicted boat traffic value from random forest model for lake or pond. Was manually set to 0 in NYC Reservoirs with restricted boating access. | Output of a random forest model using WISPA boat launch data as independent variable |
| Motor Traffic | 2 | Risk of invasive introduction via people | Weighted sum of the average annual daily traffic on lines within 100 meters of the lake or pond. | Department of Transportation |
| Straight line Distance to nearest invasive | 1 | Proximity of lake or pond to invasives | Distance to nearest iMapInvasives aquatic invasive record | iMapInvasives |
| Flowline distance to nearest invasive | 1 | Proximity of lake or pond to invasives | Distance along flowlines to nearest iMapInvasives aquatic invasive record | iMapInvasives |
| Number of species of aquatic invasives within 7.4 km | 2 | General invasive pressure within waterfowl dispersal range | Number of unique aquatic invasive species, as reported by iMapInvasives, within 7.4 km of pond/lake. | iMapInvasives |
Component 2: Lakes Suitable for Establishment
To represent the risk of invasive species establishment, we constructed species habitat models for a suite of eight aquatic invasive species to predict the suitability of every lake and pond to each species. These eight species were selected with guidance from the steering committee to represent major functional groups of aquatic invasive species. The species habitat models were constructed using iMapInvasives data and environmental data (see the supplemental information [XLSX, 5.5MB] for more details on variables used). The following species were modeled:
- Water Chestnut (floating plant)
- Hydrilla (submerged plant)
- Eurasian Watermilfoil (submerged plant)
- Starry Stonewort (submerged algae)
- Northern Snakehead (fish)
- Rusty Crayfish (benthic arthropod)
- Spiny Waterflea (planktonic arthropod)
- Zebra Mussel (benthic bivalve)
Based on species distribution model outputs, all lakes and ponds were sorted into suitability classes (low, medium, high) for each species using thresholds selected through expert review. See the species model metadata (PDF, 4.2 MB) document for information on the models for each species.
Component 3: Lakes Potentially Impacted
Waterbodies of high ecological condition with minimal stressors are at risk to the greatest impacts if invaded. We modeled potential impact using several metrics of ecological condition, recreational value, and stressors, ranked with input from the advisory committee. These metrics included the Landscape Condition Assessment (LCA), occurrences of rare species and significant ecological communities (NYNHP), harmful algal blooms (HAB), fishing activity (from the top recreational fishing waterbodies listed in a NYSDEC report, and Watercraft Inspection Steward Program data).
| Potential Impact of Invasion Variable | Weight in Impact Score | Variable Is a Measure of… | Calculation Summary | Data Source |
|---|---|---|---|---|
| Average Landscape Condition Assessment score | 20 | Water and Habitat Quality | Average value for lake or pond | LCA: Combined model of anthropogenic disturbance including roads, agriculture, historical land use, development |
| Average Biological Assessment Profile score of flowlines through pond/lake | 15 | Water and Habitat Quality | Average value for flowlines passing through a lake or pond | Biological Assessment Profile - predicted model of water quality based on presence of invertebrates |
| Native fish richness | 15 | Water and Habitat Quality | Average Z-score for flowlines passing through a lake or pond | Predictive models of habitat suitability for native fish in New York streams created by Jim McKenna, NYSDEC |
| Rare plants and Animals | 15 | Presence of rare species | Sum of the scores for all eos in the lake or pond. Scores weight eos by rareness, quality, and age | New York Natural Heritage Program Element Occurrences (EOs) |
| Number of NYNHP significant natural communities | 15 | Presence of significant natural communities | Number of Natural Community eos in or adjacent to lake or pond. | New York Natural Heritage Program Element Occurrences |
| I FISH NY recommended lakes | 10 | Recreation impact- potential loss of fishing opportunities | Full points if on the list | NYSDEC Lakes List |
| Proportion of WISPA visits for fishing purposes | 5 | Recreation impact- potential loss of fishing opportunities | Proportion of visits with fishing as stated primary purpose | WISPA data |
| Likelihood of Harmful Algal Blooms | 5 | Water and Habitat Quality | Random forest predictive model of number of years with a report of a HAB (out of 8) | Output of random forest model of number of years with at least one reported HAB |
Online Prioritization Tool
The Prioritization Tool begins with the full set of lakes, either throughout New York State, or restricted to the PRISM chosen by the user. The user then applies thresholds to risk of introduction, risk of establishment, and potential impact in sequence to filter down to final subset of lakes likely to warrant increased survey or management attention based on the specific priorities set by the user. The outputs generated are intended to provide guidance and not as a replacement to local expertise. As this tool cannot capture all factors which influence management decisions, the user is expected to further refine and research the results.
Instructions: This tool is user driven - you can decide to what extent each component filters lakes depending on your priorities. The filters are intended to be used in the order in which they are presented along the left side of the interface.
Step 1 - Select your region of interest. The tool defaults to all 8,683 lakes and ponds statewide. You can restrict the output to one or more PRISMs by clicking the “Filter by PRISM” toggle, then selecting the PRISM(s) of interest.
Step 2 - Introduction Risk: Drag the slider to prioritize lakes over a certain threshold for estimated introduction risk (use the histogram as a guide and read the help text when hovering over the histogram).
Step 3 - Establishment Risk: Select the proxy species you want to consider, and then select at what level of modeled probability of suitability you want to include (medium-high suitability will select more lakes than high suitability only; low-med-high would select all lakes).
Step 4 - Potential impact (“what’s at stake”): Drag the slider to prioritize lakes over a certain threshold for estimated potential impact (use the histogram as a guide and read the help text when hovering over the histogram).
Once you have gone through the tool selections, you can capture screenshots of the map showing the selected lakes, generate a summary report, and download a spreadsheet of your prioritized of lakes.
Tips for using the outputs:
- Map Viewer: After completing the sequence of filters, uncheck the boxes on the map for All Lakes, Risk of Introduction, and Suitable for Establishment layers. This will leave the “Potentially Impacted” lakes layer easier to see. Zoom in on the purple points to see the lake shape and to click on it for more lake information.
- Generate Report: Check your downloads for an HTML file called “report”. This will open in your default web browser. This report captures the filter selections made for the current output of lakes in the map viewer and the results download.
- Results Download: Check your downloads for the “ShapeExport” zip folder. This contains a GeoPackage file for use in ArcGIS or equivalent software, and a CSV file which can be opened as a spreadsheet in Excel. Both files can be joined to the Supplemental Information file via the NUMID field, which is the unique identifying number for each lake. This will allow you to filter for additional metrics such as lake size.
- To access the data that the online prioritization tool references (for all included waterbodies), use the download links below. Note: Use the NUMID column to join the attribute table in the Supplemental Information to the point or polygon feature class in the geodatabase.
- Spatial information (polygons and centroids) for the waterbodies included in this analysis: geodatabase (ZIP, 3.4 MB)
- Attribute table for the waterbodies included in this analysis: (XLSX, 5.5 MB)
- Detailed information on the habitat suitability models created for each species in the risk of establishment component can be accessed in species model metadata (PDF, 4.2 MB).
The online tool is available at https://lab.nynhp.org/aquatic-invasive-prioritization/.
April 13, 2022 | Updated Aug. 19, 2022, 4:29 p.m.