Management Outcomes Analysis
Leveraging iMapInvasives data to summarize and visualize outcomes of invasive species management.
Summary
The goal of this project is to evaluate the outcomes of invasive species management efforts using data reported to New York iMapInvasives. To do so, data were organized into management sites based on location and species, then outcomes were assigned based on the data available for each site. Management outcomes are published to a publicly available ArcGIS dashboard, as well as a data explorer for PRISM and State Agency staff. These map viewer tools provide accessible means for users to visualize and explore summarized invasive species management data.
Launch the NY iMapInvasives Management Outcomes Public Viewer
Project Need and Background
Post-treatment monitoring data are critical for understanding the impacts of invasive species management efforts. However, these data have historically been under-collected, under-reported, and are largely decentralized. This project aims to use the wealth of data in iMapInvasives to summarize the outcomes of invasive species treatments and make those data accessible in a visual format.
Methods
In order to determine the outcomes of invasive species treatments, we needed to first create spatial units for analysis. Data in iMapInvasives are observation-based, as opposed to site-based. As a result, we created a process for delineating management sites, which allowed us to link records together for use in analyzing change over time. These management sites are based on treatment polygons (Figure 1), and not-detected records that have been designated as “Presumed Eliminated”, with “due to treatment” given as the reason (Figure 2). The management site delineation process involved organizing data by location, species, and date (Figure 3).
Once data were organized into management sites, they were then assigned outcomes depending on the available data. For sites where the target invasive species is assumed to be present based on presence or treatment records, outcomes were assigned depending on the availability of abundance data (area or percent cover). The outcome assignment process is detailed in Figure 4, and outcome definitions are outlined in Table 1.
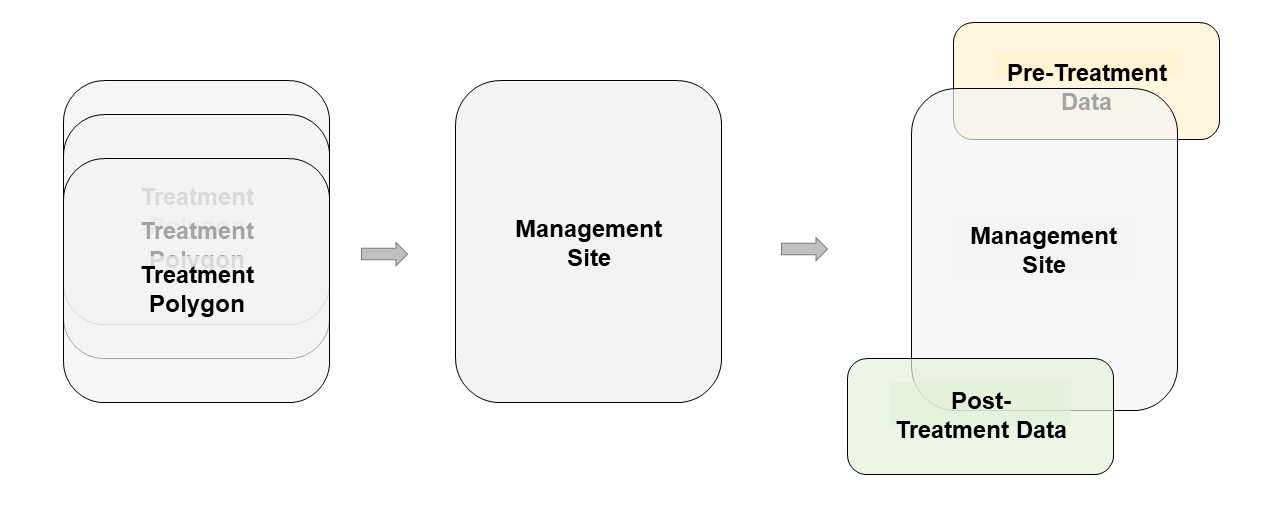
Figure 1. Conceptual diagram of management site delineation process based on treatment polygons. Treatment records which are spatially intersecting and match in species are combined to create the management site—the spatial unit for this analysis . Then, pre-treatment and post-treatment data which spatially intersect the management site and match in species are spatially joined to the management site.
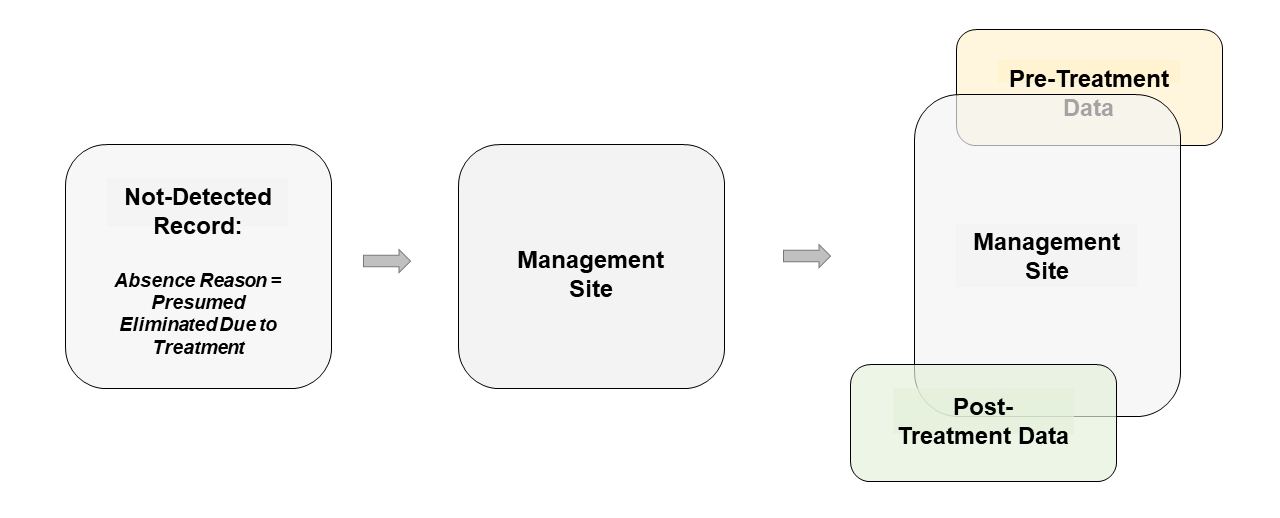
Figure 2. Conceptual diagram of management site delineation process based on not-detected polygons. Not-detected records which do not have intersecting treatment data but are entered as “presumed eliminated due to treatment” are organized into management sites separately from the management sites based on treatment records.
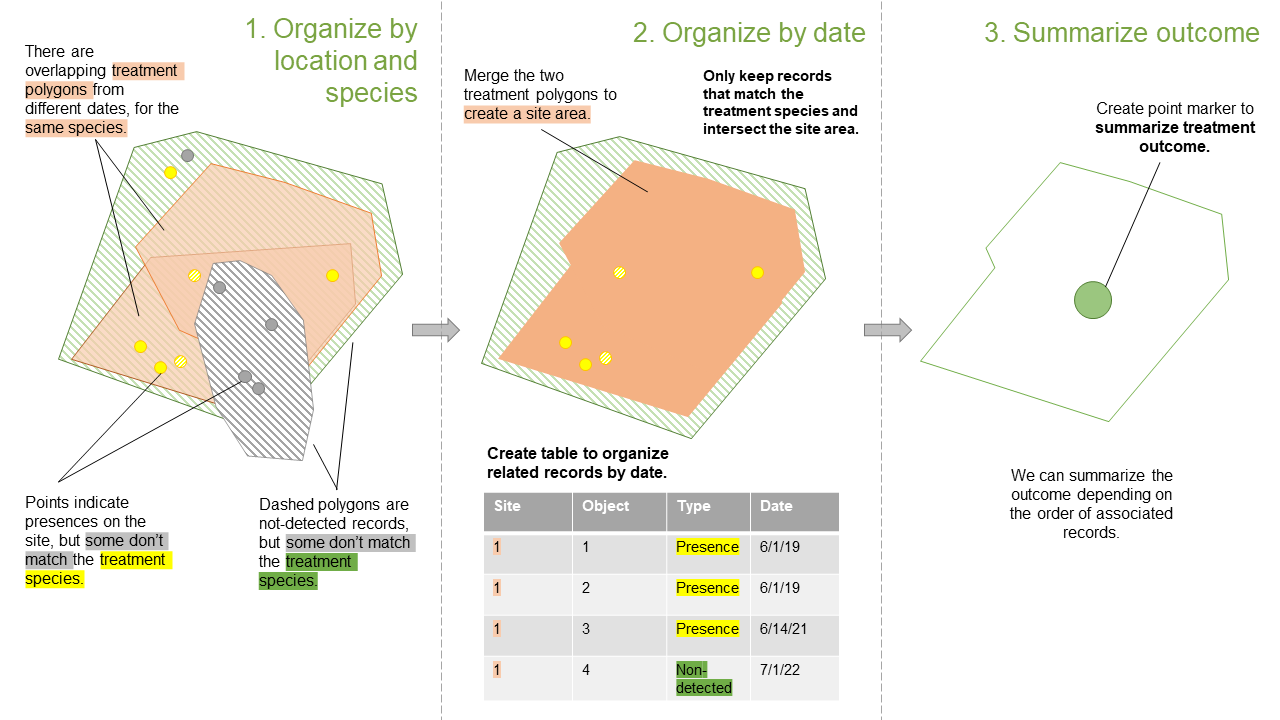
Figure 3. Conceptual workflow for organizing management sites by location, species, and date.
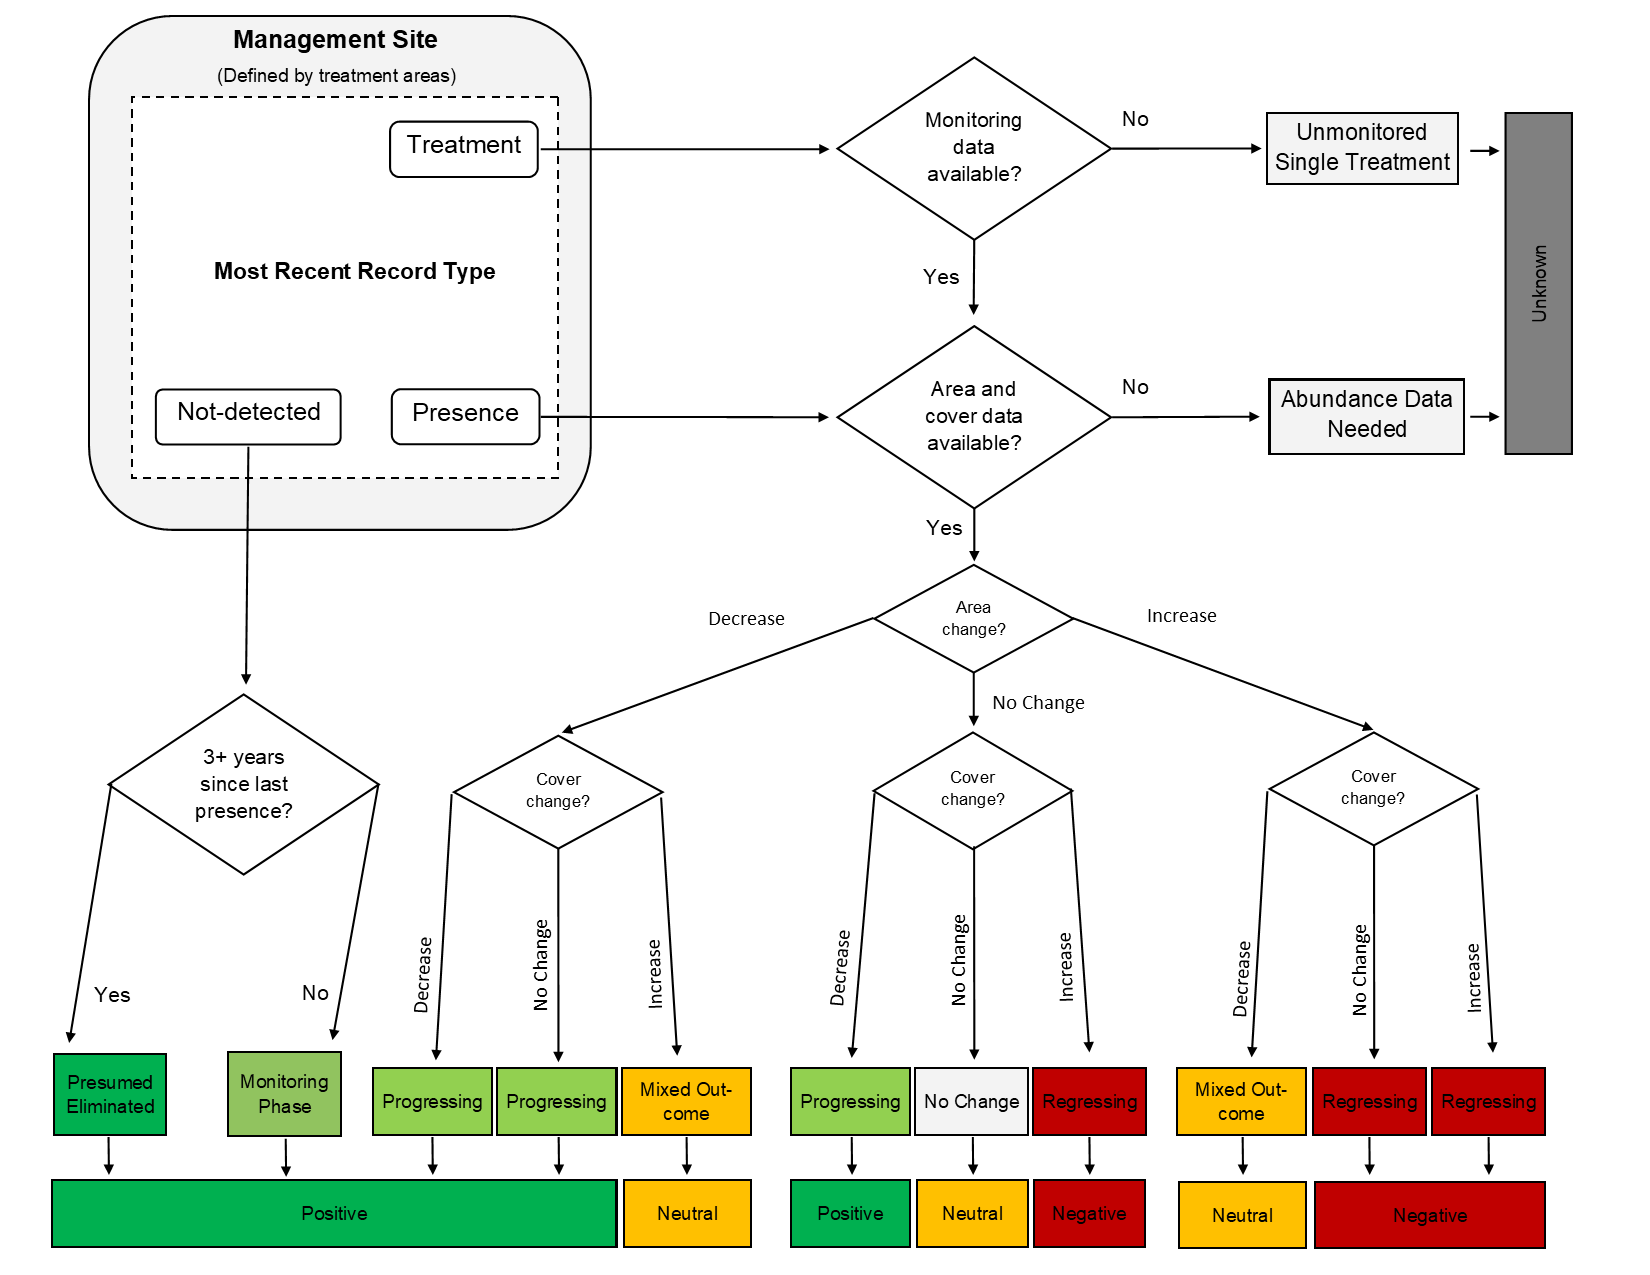
Figure 4. Process for assigning outcomes to management sites based on available data. Management sites are first assessed for which record type is the most recent record associated with that site. For sites where a treatment or presence are the most recent record type, they are then further assessed for the availability of post-treatment monitoring data generally, then abundance data. Where abundance data are available, sites are assessed for changes in area and percent cover from the initial detection to the most recent detection, and are assigned an outcome accordingly. For sites where a not-detected record was the most recent record, sites are assessed based on the time elapsed since the most recent detection. After outcomes are assigned, the evaluation of outcome is assigned, which simply describes the outcome as positive, neutral, negative, or unknown (Table 1).
|
Evaluation of Outcome |
Outcome |
Outcome Definition |
|
Positive |
Presumed Eliminated |
The target invasive is most likely absent, as indicated by a recent non-detection record. Three or more years have passed since the last detection of the target invasive. |
|
Monitoring Phase |
The target invasive is most likely absent, as indicated by a recent non-detection record. The species has been detected within the last three years, so more monitoring is needed before declaring the target invasive “presumed eliminated”. |
|
|
Progressing |
The target invasive is still present as indicated by a presence or treatment record. There has been a tangible decrease in the percent cover and/or the area of the target invasive since the first detection. |
|
|
Neutral |
No Change |
The target invasive is still present as indicated by a presence or treatment record. There has been no change in the percent cover category, and the area has not changed by more than 25% of the initial detection area. |
|
Mixed Outcome |
The target invasive is still present as indicated by a presence or treatment record. The outcome is mixed because either the area or percent cover has significantly decreased, while the other has significantly increased. |
|
|
Negative |
Regressing |
The target invasive is still present as indicated by a presence or treatment record. The area and/or present cover has increased significantly since the initial detection. |
|
Unknown |
Abundance Data Needed |
The site has been visited following the initial treatment, but lacks the abundance data needed to indicate whether the target invasive population has changed since initial detection. |
|
Unmonitored Single Treatment |
There are no post-treatment data following the initial detection, therefore the status of the target invasive population is unknown. |
Use and Interpretation of the Management Outcomes Viewer
The post-treatment data viewer by default shows all management sites documented in iMapInvasives for NY (over 10,000 sites). The data viewer includes a pie chart summarizing the breakdown of evaluations, as well as a table summarizing the species being managed. The map viewer is dynamic, so the chart and table will scale to the current map view as the user navigates the map. The user can use the filter tools to filter by evaluation of outcome, PRISM, or target invasive species.
Launch the NY iMapInvasives Management Outcomes Public Viewer
Note: The outcomes assigned in this map viewer are not meant to be definitive statements regarding the outcome or effectiveness of treatment for each given management site. All outcomes presented are based directly on data available in iMapInvasives as of the date listed in the map viewer description. Given that nearly 70% of management sites have unknown outcomes, there is reason to believe that for many sites there are missing data. However, this map viewer is useful for outlining where management is occurring, on what species, and the outcome for sites with sufficient data available. Additionally, the map outlines where data is and is not available. In summary, the map viewer provides data-driven estimates for the outcomes of treatment based on available data.
PRISM and State Agency staff looking to use the management outcomes data explorer can contact us for more information at: imapinvasives@dec.ny.gov.
Aug. 31, 2023 | Updated Sept. 13, 2023, 6:46 p.m.